Urbint report cards provide a critical assessment of various aspects of the natural gas distribution landscape—from excavation damage to vintage pipe materials to leaks—and generates a performance grade for each area.
Here, we analyze excavation damage nationwide and state-by-state. Through this analysis, we establish key metrics measuring damage prevention performance and also evaluate how states compare against each other in 2018. Read on to find out how your state(s) stacks up.
Metrics Used
Our damage prevention grading leverages two metrics to assess performance:
- Hit Rate (the number of excavation damages per 1,000 One Call or 811 tickets)
- Excavation Damage per Exposed Facilities
Hit rate is a widely used metric in the industry to track damage prevention performance. It does a great job capturing improvements in call-in procedures. However, because the hit rate normalizes the number of damages against the number of tickets, an increase in ticket count can overwhelm the metric and drive the hit rate down regardless of actual damage count changes. In fact, from 2010 to 2018, approximately 120 gas operators saw a reduction in their hit rate but an increase in their actual damage count, suggesting that the hit rate does not provide the complete picture. We believe that, while hit rate is a widely used metric in the industry, it should be paired with a metric that does not use the number of tickets as the denominator.
As a result, absent the collection of additional data, we utilized a separate metric to measure performance: excavation damage normalized by service territory size. This metric normalizes the number of excavation damage against the size of a territory in terms of main miles and services. Because service territory changes are less volatile, we believe that this provides a more accurate assessment of year-over-year changes and allows us to compare states that might have very different 811 call behaviors.
Based on these two metrics, we’ve established a grading system to measure damage prevention improvements nationwide and for individual states. (Further details on the grading system are provided at the end of this post.)
Nationwide
Hit Rate Improvement Score (2018): C
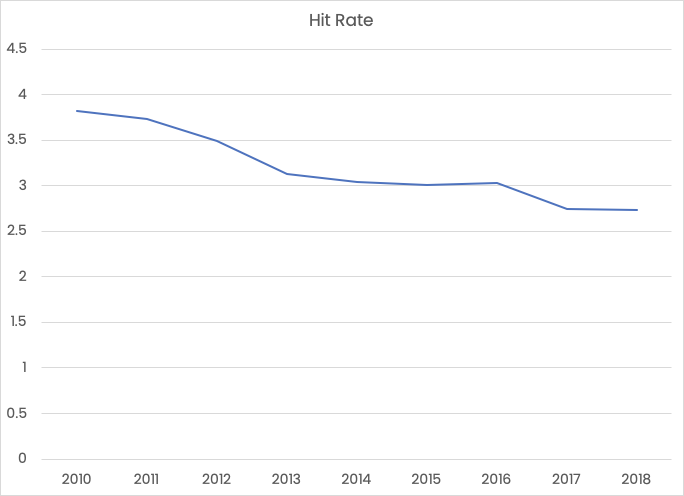
The chart below shows how the nation’s hit rate has changed since 2010.
In 2018, the industry saw a statistically insignificant reduction in hit rate. The hit rate went down from 2.75 damages per 1,000 tickets in 2017 to 2.73 in 2018. With a hit rate that effectively remained the same between 2017 and 2018, the nation received an average grade of “C” for hit rate improvement.
It is worth observing a cyclical pattern in hit rate changes, with some years seeing significant reductions followed by a few years of little to no change. The most recent significant reduction in hit rate was from 2016 to 2017, when the nation reduced the hit rate from 3.03 to 2.75.
Damage per Service Territory Size Improvement Score (2018): D
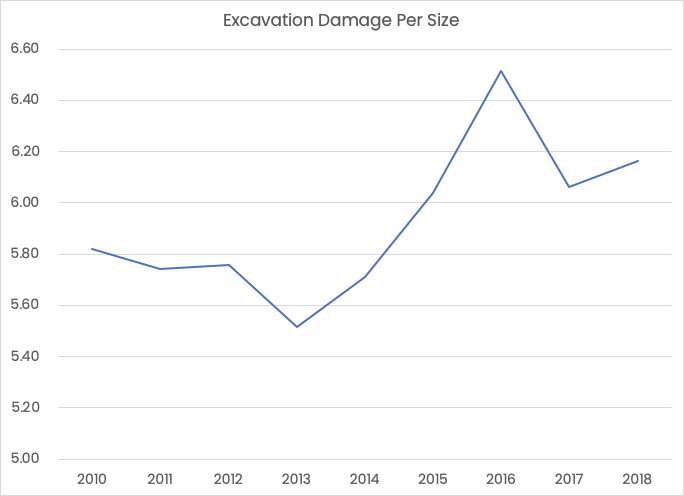
The chart above shows how the nation’s damage per territory size has changed since 2010.
In 2018, the industry saw a slight increase in excavation damages per service territory size. This notable increase in damages per territory size earned the nation a “D” grade.
A historical review of this metric shows significant changes year-to-year. 2016 saw a major increase in damage per territory size, followed by a reduction in 2017.
2018 State Comparison
Hit Rate
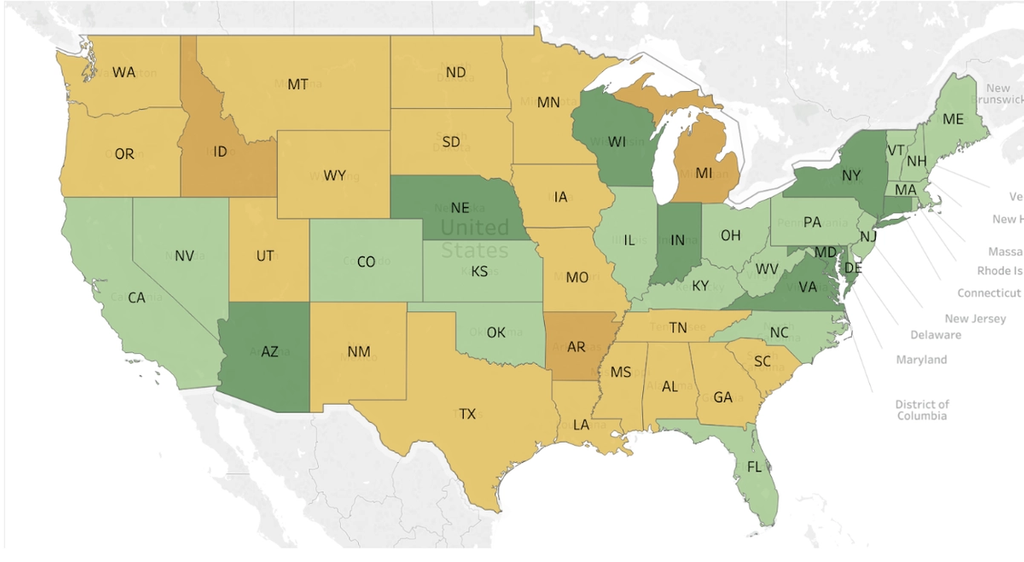

*Not shown on the map: Alaska, with a “D” grade
Top 10 states with the lowest hit rate in 2018:
- Maryland, with a hit rate of 0.95
- Virginia, with a hit rate of 0.96
- Arizona, with a hit rate of 1.12
- Connecticut, with a hit rate of 1.27
- New York, with a hit rate of 1.62
- Nebraska, with a hit rate of 1.67
- Wisconsin, with a hit rate of 1.68
- Indiana, with a hit rate of 1.71
- Washington D.C., with a hit rate of 1.74
- New Jersey, with a hit rate of 1.91
Top 10 states with the highest hit rate in 2018:
- Arkansas, with a hit rate of 6.8
- Idaho, with a hit rate of 6.38
- Alaska, with a hit rate of 6.14
- Michigan, with a hit rate of 4.95
- South Dakota, with a hit rate of 4.80
- Mississippi, with a hit rate of 4.73
- Alabama, with a hit rate of 4.23
- Tennessee, with a hit rate of 4.06
- Texas, with a hit rate of 4.02
- New Mexico, with a hit rate of 3.62
Excavation Damage Per Service Territory Size (2018)
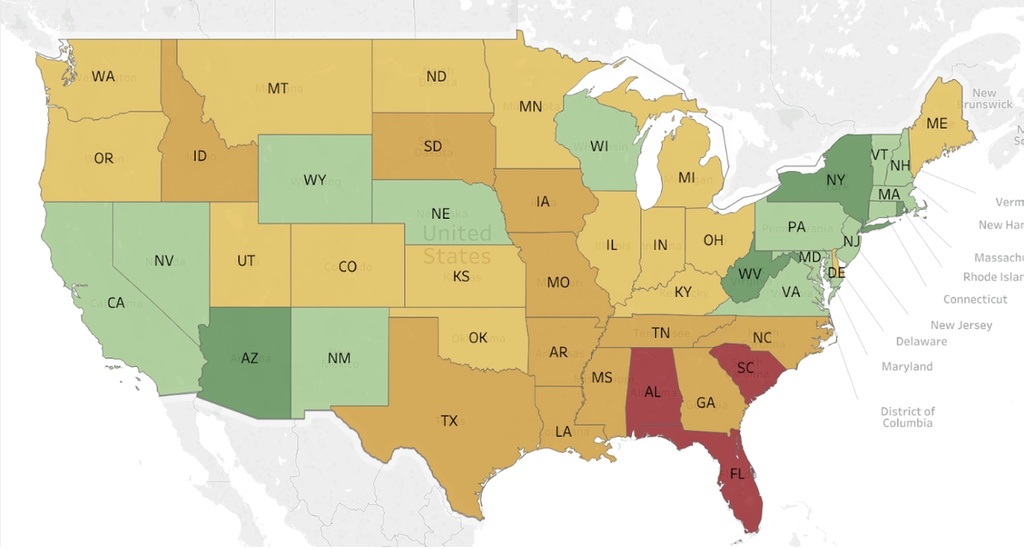
*Not shown on the map: Alaska, with a “C” grade
Top 10 states with the lowest damages per size in 2018:
- Rhode Island, with a score of 2.58
- Arizona, with a score of 2.72
- New York, with a score of 2.81
- West Virginia, with a score of 2.84
- Connecticut, with a score of 2.92
- New Mexico, with a score of 3.02
- Nevada, with a score of 3.24
- Wisconsin, with a score of 3.4
- Vermont, with a score of 3.58
- Massachusetts, with a score of 3.59
Top 10 states with the highest damages per size in 2018:
- Florida, with a score of 12.65
- Alabama, with a score of 12.6
- South Carolina, with a score of 11.7
- Arkansas, with a score of 10.16
- Texas, with a score of 9.91
- Idaho, with a score of 9.90
- North Carolina, with a score of 9.10
- Mississippi, with a score of 8.95
- South Dakota, with a score of 8.75
- Tennessee, with a score of 8.44
Finding the Right Solutions to Succeed
While a few territories are seeing straight As, improvements are still needed across the board. The reality is that increasingly complex operating environments—along with construction and urbanization leading to a higher prevalence of issues like no-calls and mislocates—make damage prevention a continuous area of focus for LDCs.
Interested in learning more about how artificial intelligence can enable you to minimize excavation damage? Check out Urbint Lens for Damage Prevention.
Analysis Details
About the Scoring Methodology
The hit rate was calculated by dividing the number of excavation damages by 1,000 tickets for the territory. Nationwide and statewide aggregation involve aggregating all damages in the nation or state, and then dividing it by the aggregated ticket count.
The excavation damages per territory size involved dividing the number of excavation damages by a Urbint-calculated service territory size metric. The service territory size metric accounts for the number of main miles and the number of services, balancing both as equally important.
From there, below are the grade thresholds used.
For hit rate (damages per 1,000 tickets):
- A: Less than 1.8
- B: Between 1.8 and 2.97
- C: Between 2.97 and 4.81
- D: Between 4.81 and 9.40
- F: Greater than 9.40
For damages per territory size:
- A: Less than 2.91
- B: Between 2.91 and 4.73
- C: Between 4.73 and 6.95
- D: Between 6.95 and 11.07
- F: Greater than 11.07
For each metric, these thresholds are established by taking the 20–40–60–80 percentile across the 2010 to 2018 data.
To score based on improvement rate, the percentage change was first calculated for both the hit rate and the damage per territory size. The percentage change is determined by taking the difference and dividing that by the previous year’s metric. As an example, the hit rate percentage change for 2018 would be taking the change in hit rate from 2017 to 2018, and dividing it by the hit rate in 2017.
From there, the percentage change is scored based on the following ranges:
- A: Greater than a 5% decrease
- B: 1–5% decrease
- C: 1% decrease to 1% increase
- D: 1–5% increase
- F: Greater than a 5% increase
Source and Disclaimers
Our analysis leverages data from the Pipeline and Hazardous Materials Safety Administration (PHMSA) Annual Reports, officially known as “Annual Report Data from Gas Distribution, Gas Gathering, Gas Transmission, Hazardous Liquids, Liquefied Natural Gas (LNG), and Underground Natural Gas Storage (UNGS) Facility Operators”. The original source of the data is available here.
Because PHMSA only started tracking what commodities each operator was distributing in 2015, and because our analysis goes back to 2010, before specific commodities were being tracked, it does include data for other types of gas.
The 2018 data shows that natural gas is the predominant commodity represented in this dataset for the nation and also for the majority of the states. In 2018, Natural Gas represents 99.8 percent of main miles reported and 99.8 percent of the services reported. For all states, with the exception of Hawaii and Puerto Rico, Natural Gas represents at least 95 percent of main miles reported and at least 95 percent of services reported. Hawaii and Puerto Rico are excluded from the analysis because their main miles and services do not primarily serve Natural Gas.